| Series |
|---|
May 17 is R G B Day! Celebrate and learn about the foundational color process.
RGB. It’s a color process that’s everywhere.
RGB is inside our camera sensors, the pixels on your monitor, the color picker in your grading tool, the math behind every Log transformation, the scopes measuring the pixels, film emulsion, color spaces, LUTs, sliders, and more.
Nearly everything we do in our craft can be narrowed down to the manipulations of these 3 ‘letters’.
The RGB Color Process Celebrated Its 160th Anniversary On May 17, 2021
The very first color photograph was based on the RGB color process. From that first color photograph to today’s Rec. 2020 imaging standard – RGB is central to image reproduction. But why should a Colorist, Cinematographer, Director, or Designer want to know more about this theory and its history? And… Why now?
(drum roll)
160 years before we recorded this webinar, on May 17th, 1861, the great Scottish scientist James Clerk Maxwell and his friend, photographer Thomas Sutton, took the very first color photograph ever:

That photo gave birth to the RGB color process that we’ve been using in our field for 160 years (and counting).
This extraordinary experiment by one of the greatest minds to ever live was the culmination of a study J. C. Maxwell conducted several years before (he studied the elusive nature of colors). Maxwell’s research narrowed in on a 2500-year-old question:
What Is Color?
And the exciting thing about the answer to this question? Maxwell’s discoveries gave birth to the endless tools and applications in our visual profession. From the terminology and culture cues that we apply in our workflows to the mysteries of our visual system – R G B is everywhere.
We owe Mr. Maxwell our profession!
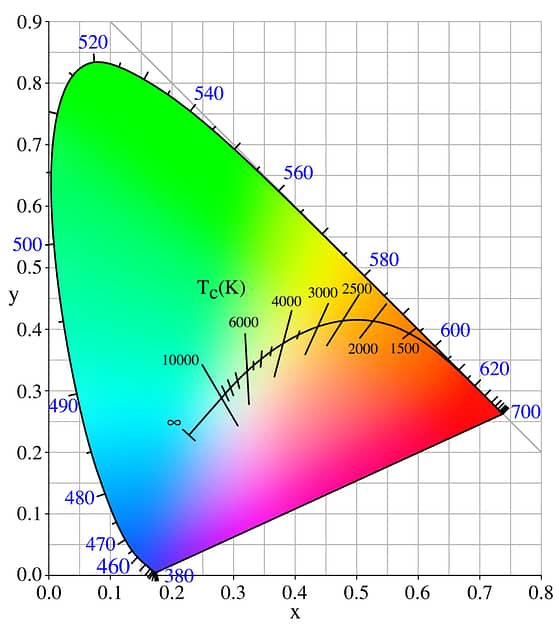
70 years later, the CIE summed up our accumulated RGB knowledge in the famous horseshoe chromaticity chart still so prominent and critical in our work – coincidently celebrating its 90th birthday this year:

The story of colors is a story of humanity’s endless curiosity and ingenuity, attempting to understand and recreate the world around it. Of course, it’s also the story of RGB.
Webinar Audience & Topics
This webinar was recorded on the 160th anniversary of the first color photograph. This is a beginner to intermediate level webinar suitable – for all colorists, editors, filmmakers, cinematographers, and anyone else with an interest in color.
Not a math person? Don’t worry! This webinar will not go in-depth on scientific concepts and processes but will provide you with must-know information:
- What is color – a (hard) thought experiment.
- How colors were explained in ancient times
- From Newton’s prism to Maxwell’s RGB – a 150-year exploration in understanding color’s true nature.
- Human color vision and the famous 1931 CIE horseshoe – how RGB was quantified.
- RGB is everything – How our tools and workflows follow Maxwell’s discoveries.
- Your questions answered!
-Team Mixing Light and Hector Berrebi
Special Thanks to Our Raffle Contributors
- ColourSpace LTE by Light Illusion – “ColourSpace enables unprecedented and previously unachievable levels of accuracy and data reporting for display calibration, colour management, and colour workflows.”
- Ideal-Lume Pro by MediaLight Desk Lamp – CIE D65 balanced, CRI 98, dimmable task light
- MediaLight Mk2 Eclipse 1 Meter Bias Light – CIE D65 balanced, USB-powered bias lighting system
- Mix Mini 2 Color Sensor – Convert physical colors into RGB values, in seconds
- CMY Cubes – “Each face of the translucent cube is coated in electromagnetically subtractive materials which at first, appear as cyan, magenta, or yellow.”
Table of Contents
00:10 – Introductions
02:10 – Live Webinar Prize Giveaway Announcement
04:10 – Hector Berrebi Introduction
05:10 – Why are we celebrating RGB Day, today?
06:53 – What are you *actually* doing (in the real world) when you’re color correcting an image?
08:20 – A closer look at a modern display (and RGB in action)
12:40 – Why color is such a hard topic to discuss or explain (and the definition of Qualia)
17:03 – How the CIE standards organization defines light as being more than just a physical phenomena
18:21 – How it’s possible to see the color ‘red’ in an image when there are no actual red pixels in that image (this is the Twitter account of the experimental psychologist that Hector mentions)
20:22 – A super-abbreviated history of color theory through the ages (Theory of Colours, Kindle version, Amazon USA)
22:15 – Why color theory is important to professionals and why Maxwell’s photograph ushered in a new visual era
24:05 – Color, its relationship to light, and Sir Isaac Newton’s breakthrough in our understanding of light
26:00 – The very first color system, developed by Newton
28:11 – Newton’s hue system as visualized by David Briggs (huevaluechroma.com)
31:09 – Question: What about the correlation between colors and feeling?
33:22 – From Newton to Maxwell, a man who laid the foundation for much of modern science (and you probably never heard about)
34:51 – Mapping human color vision… with spinning tops – and proving the human trichromatic visual system
38:28 – Using three triangles to calculate a single point in a larger triangle – creating a color coordinate system
43:09 – A simple demonstration of RGB color theory basics
44:18 – No light? No color.
47:11 – If light is color, what frequency is pink?
48:12 – Fundamentals of the human visual system
50:02 – The (visual) difference between ‘real space’ and ‘display space’
51:14 – Photopic Vision: Non-linear receptors
53:02 – Maxwell’s first color photograph is a proof of concept
55:50 – Maxwell was brilliant. But he was also lucky.
61:54 – Black, white, RGB pixels, and luminous perceptual ratios (oh, my)
64:02 – Maxwell’s 160-year legacy to us, today
64:55 – The 1931 CIE Chromaticity chart
67:06 – How the Standard Observers, observed
69:36 – What is chromaticity?
70:40 – Why the 1931 CIE Chromaticity chart is the foundation of display systems
72:06 – Question: What does it seem camera systems have extra green representation?
75:10 – Upcoming SMPTE+ seminars
76:29 – Recreating Maxwell’s original photographic projection, using DaVinci Resolve (implementing Maxwell’s RGB color theory via the CIE Chromaticity chart)
79:19 – Fun with RGB in DaVinci Resolve using the Layer Mixer’s ‘Color’ composite mode
81:07 – The ‘Chromatic Adaptation’ ResolveFX plug-in
83:35 – Color correcting with Channels in DaVinci Resolve
84:09 – Thank you and goodbye


