| Series |
|---|
How well do you understand the CIE ‘Horseshoe’ Chart?

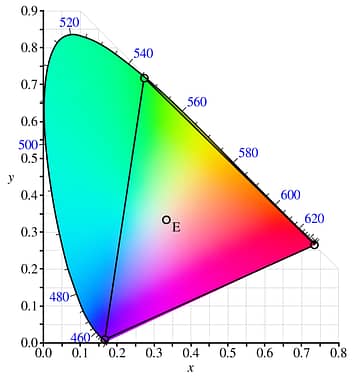
Nearly a century ago a chart was born and became the groundwork for color science and imaging developments across 4 generations: The 1931 CIE Chromaticity Chart. As media professionals, we’ve all seen the CIE horseshoe chart. It’s in our tools, our textbooks, and our manuals. And of course, in our color-managed workflows.
But how well do you understand this chart? Enough to intuitively ‘get it’? Enough to appreciate its groundbreaking achievement? Do you understand it enough to defy current dogma and challenge it? How is the methodology used in 1931 still relevant to digital video professionals today? And what will the future hold for this field and its challenges?
As we celebrate the 90th anniversary of the CIE chart this month, join Hector Berrebi and a world-famous guest speaker and color scientist, Dr. Charles Poynton.
In this webinar we explore:
- What is colorimetry & color matching?
- What is a ‘standard observer’? And how was the CIE 1931 chart plotted?
- How a color “space” is actually a 3D “space” that fits a 3D shape?
- ‘xy chromaticity’: How do you read it and how is it used?
- Party tricks with color & math on the chromaticity chart!
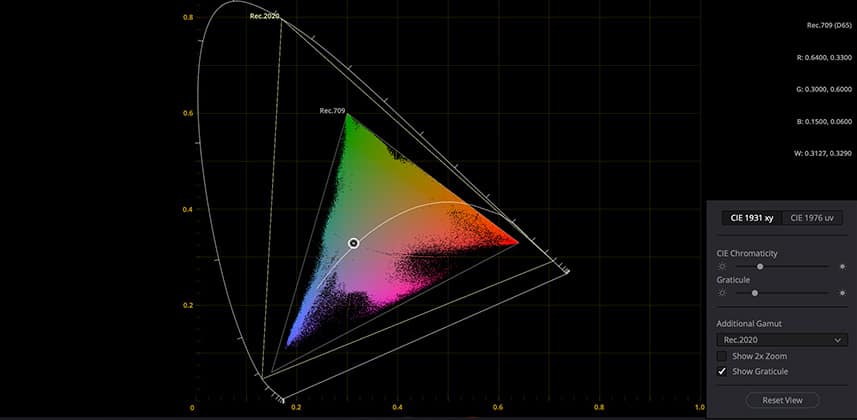
We’ll also discuss the updated 1976 and 2002 color models and why were they created? Finally, see how the CIE chart and its color space manifest inside DaVinci Resolve as it relates to:
- Vectorscope & CIE scope
- Evaluating out-of-gamut colors
Member Content
Sorry... the rest of this content is for members only. You'll need to login or Join Now to continue (we hope you do!).
Need more information about our memberships? Click to learn more.
Membership optionsMember Login


