| Series |
|---|
Part 2: Display Profiling in the Free Lightspace DPS
In the first part of this series, I walked you through installing and using the free Lightspace DPS to do our first profile. The question we’re trying to answer in this Display Profiling 101 series is, “Do I need to recalibrate my color correction reference display?” In this Insight, we’re going to read the graphs in Lightspace and learn what they mean.
At the end of Part 1 you learned that, in Lightspace, the key graph to read is the Grayscale Delta E. Any reading above 2.3 on the Y-axis is a warning: The display is drifting. Any reading above 3.0 is confirmation: You need to recalibrate your display since it’s no longer showing true colors in some areas of your image, and the error rate is clearly visible to the eye.
The bigger the Delta E, the more urgently you need to recalibrate
Here’s the Grayscale Delta E graph from the end of Part 1:
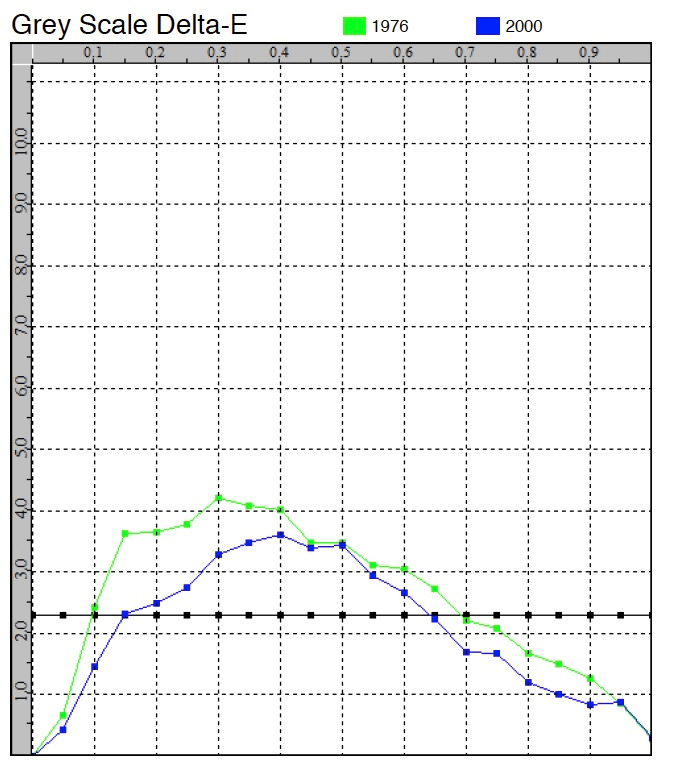
As I mentioned in Part 1 – this Delta E graph is wrong. I made a critical mistake and this graph is telling the wrong story.
When reading Delta E values, be sure you’re measuring what you think you’re measuring
Before I start freaking out, I need to figure out what the heck is going on with these Grayscale Delta E values? Are they really that bad? I start investigating by scanning the rest of the charts in this PDF I exported from Lightspace.
Most of the charts confirm the big Delta E errors throughout the mid- to lower- part of the Grayscale. One chart, in particular, offers the best clue to what’s going on:
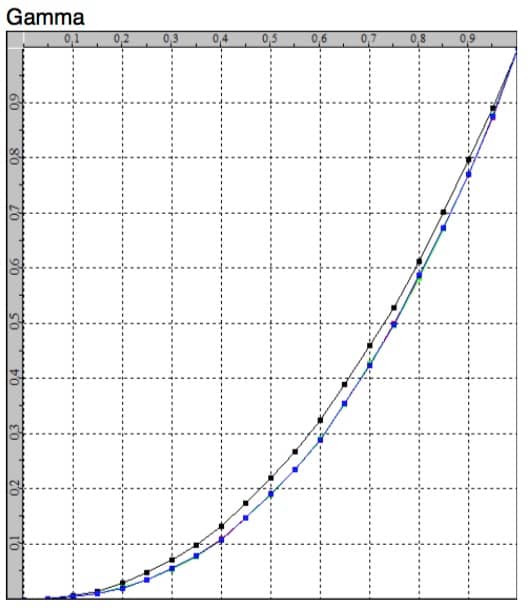
If you compare the Gamma graph to the Grayscale Delta E graph, it’s clear that the problem we’re seeing is located within the gamma curve. After all, the biggest points of divergence on the Gamma scale (from 30 – 70) perfectly lines up with those identical areas of Grayscale Delta E errors.
But will a recalibration fix this problem?
To answer that question to scroll to the top of the PDF and read this section:

If I look at my external reference monitor and check its settings, it is indeed set for a Gamma of 2.4.
But in Lightspace DPS, the Target Gamma was set for a Gamma of 2.2.
If I wanted to measure my display accuracy with a 2.2 Gamma, then these results would be accurate!
But I didn’t. I work at Gamma 2.4, I wanted to test against a 2.4 Gamma – yet for some reason, the Target Gamma was set to 2.2 and I don’t remember ever setting my Target Gamma!
Reading this PDF I realize that my display may be accurate for 2.4 gamma – but to be sure we’ve got to change our Target Gamma and regenerate all of our graphs in Lightspace.
Watch the video Insight to learn how you to check and change the Target Gamma
Essentially, you’ll need to save a custom Rec 709 color space that updates the default 2.2 Gamma to the Gamma I actually want to profile against.
And the cool thing? In the video, you’ll learn how you don’t even need to re-profile the display to update these results! The graphs in Lightspace are interactive. Once we’ve made this change you’ll see my final Grayscale Delta E values (against the Rec 709 2.4 Gamma) look more like this:
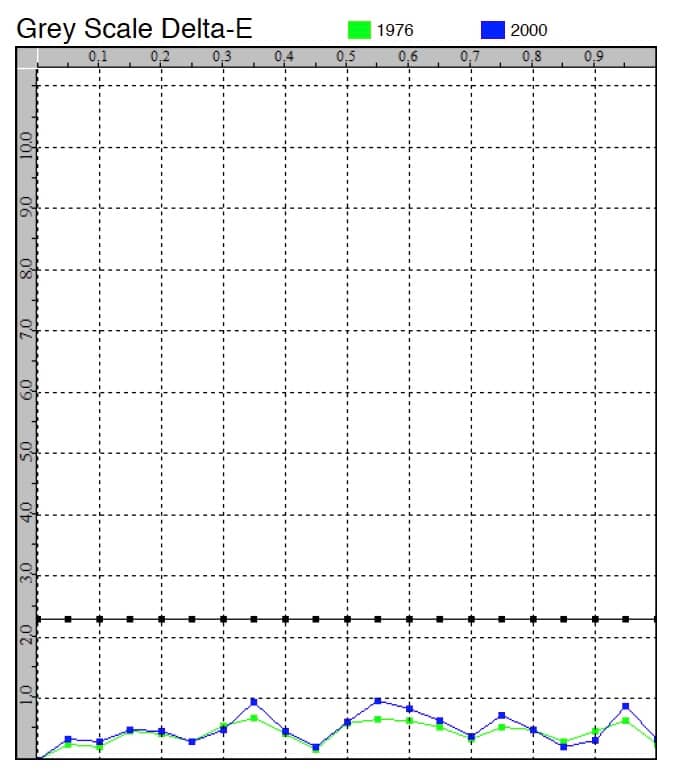
It’s amazing what a change in Target Gamma gets us, isn’t it?
A display that profiled as desperately in need of calibration transforms into measuring as the precise scientific instrument we’re paying for when we buy something like the FSI CM-250 OLED.
IF – we needed our display to be accurate against a 2.2 gamma, then the first profile we generated would have been correct.
BUT – we wanted to measure this display against the 2.4 gamma and that ‘little’ mismatch was about to cause us all sorts of mischief… until we read the report much more closely and figured out where the problem originated.
You can download and read the full and final report if you want to see what you want your graphs to look like – or at least, this is your goal and what you get for your money when you move up the totem pole of professional reference displays.
In the video below, we’ll go through each of the graphs in Lightspace
You’ll learn where to focus your attention when reading these graphs – since some of them tend to generate noise you can safely ignore. You’ll also learn how to precisely set your target gamma by modifying the presets that ship with Lightspace.
Coming up next in this Display Profiling 101 Series
We’re going to continue with one more Insight on Getting Started with Lightspace DPS. The next Insight will show you how to optimize Lightspace for the most popular and affordable entry-level colorimeter on the market, the i1 Display OEM.
The get accurate results from this colorimeter requires modification of the default options in Lightspace. If you’re itching to get started, here are the core settings we’ll end up with (for a Rev. B i1Display OEM profiling an OLED).:
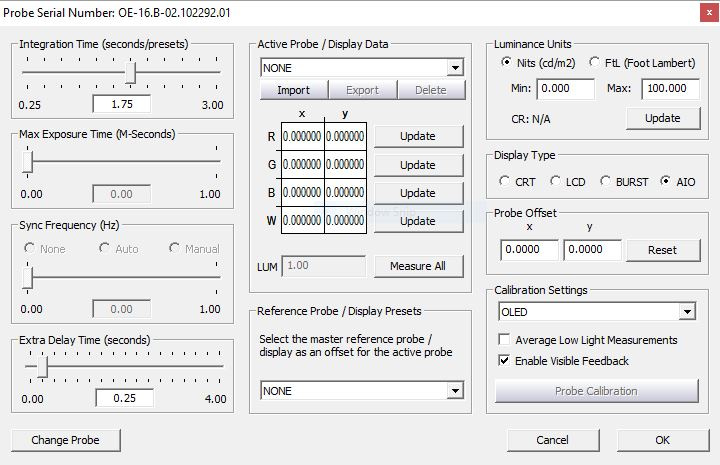
You will modify some of these settings depending on your precise display – and in the next Insight, you’ll learn what most of these settings do.
We’ll also check to see how our profiles read if you don’t have specific Offsets for the serial number of your colorimeter, compared to if you do use offset readings (and how to load them into Lightspace).
Enjoy!
-pi
Member Content
Sorry... the rest of this content is for members only. You'll need to login or Join Now to continue (we hope you do!).
Need more information about our memberships? Click to learn more.
Membership optionsMember Login

