| Series |
|---|
Day 6: 24 Insights In 24 Days – 2020 New Year Marathon!
Crunching the numbers from the Blue Collar Post Collective’s 2019 Pay Rate Survey
It’s the start of a new decade, time to reflect and take stock. As someone who collects and analyses data on the post industry, I have put together some snapshots of our Colorist community in the United States as it stands today, including who we are, what we’re doing and how much we’re being paid. This information is designed to open up the conversation on pay transparency, diversity, and definitions of our work. It should inspire us to start the new decade empowered to make our industry better for ourselves and others.
For the past four years, on behalf of the Blue Collar Post Collective, I have led a program that anonymously collects data on pay rates across the US post production industry.
Every year the data gets richer and more interesting. The number of respondents grows, and we ask more questions. The entire dataset is made publicly available for anyone to download, view and play with. Most people filter all the values, to see how their rates compare with their peers, or what people make in a job they’re applying for. The data helps a lot of people, every year, to confidently negotiate their rates. Pay transparency helps everyone, and this survey is a great way to do that on a larger scale.
The aggregate data can vary based on who participates each October. Some years more people at the senior level take part. In 2017 it was weighted more toward mid- and emerging level professionals. However, the amount of data collected is always enough to show trends and reveal valuable insights for key groups.
In 2019 we received survey responses from 130 colorists around the country (typically, we see data from 100-150 professionals in this part of the industry each year). This was a subset of 1800 respondents from across all areas of post production.
The Big Picture: Who are we today?
Pooling together the wider colorist community, our 2019 respondents numbered just shy of 200 individuals from across the United States. Two-thirds of those respondents reported their job title as “colorist”. I chose to include DITs, Dailies Colorists, Junior/Assistant Colorists and Online Editors in our wider community. I spent 20 years of my own career as an Online Editor / Finishing Artist, and have been a bigger part of the Color world than any other part of post-production.

Our professional community comes from all over the country, with respondents working in 23 of the 50 States.
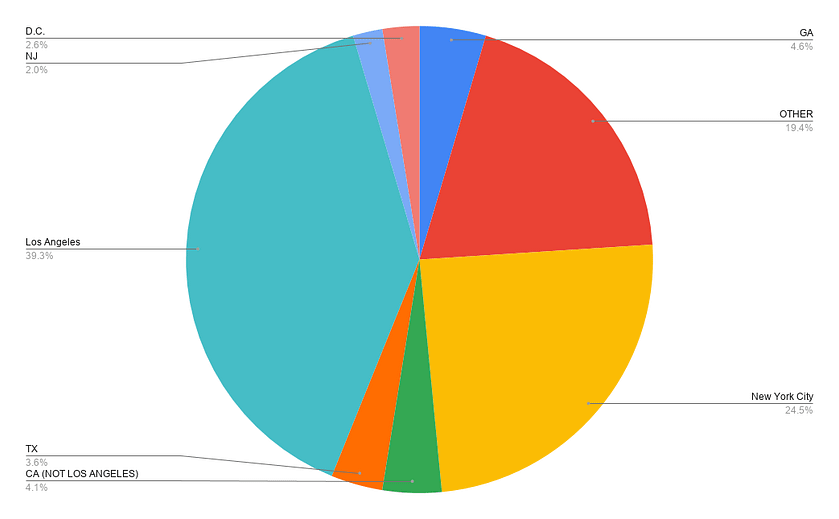
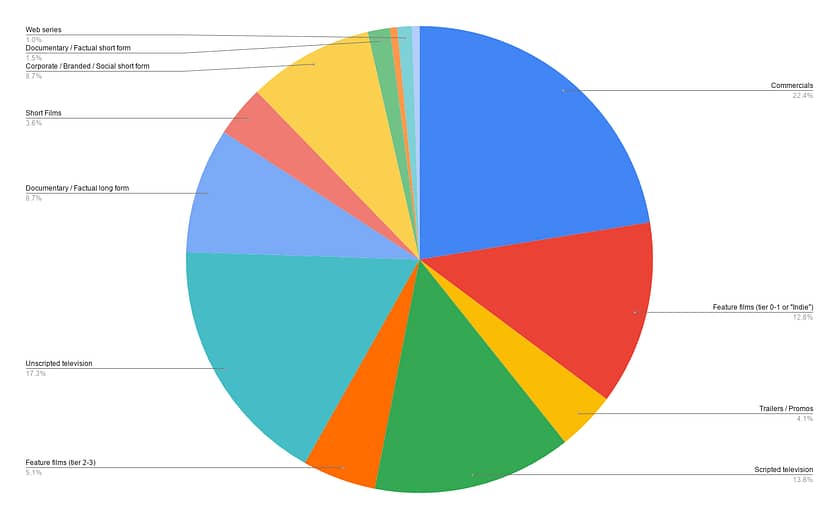
40% of our community from the 2019 survey are working in Los Angeles, with 25% based in New York City. We’re working on a wide range of content. 31% of us reported that most of our work is in television. 22% focus on commercials, 27% in features. 9% of our community works mostly in Corporate / Branded / Social Short Form content.
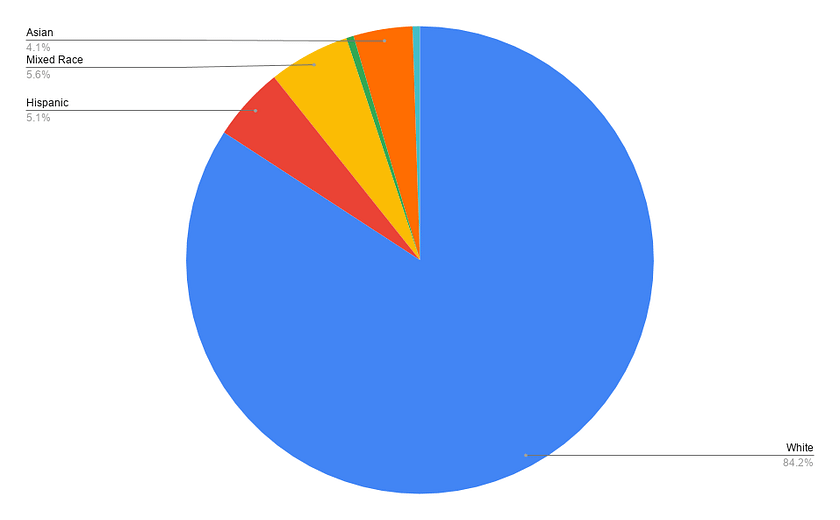
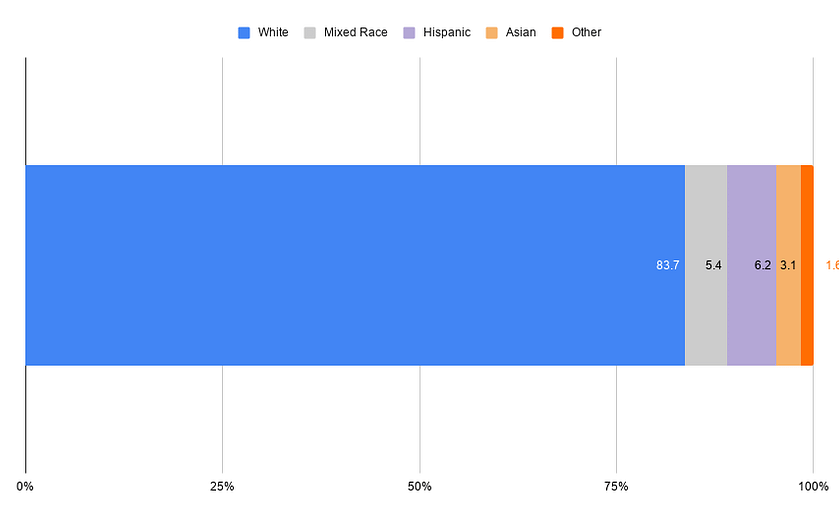
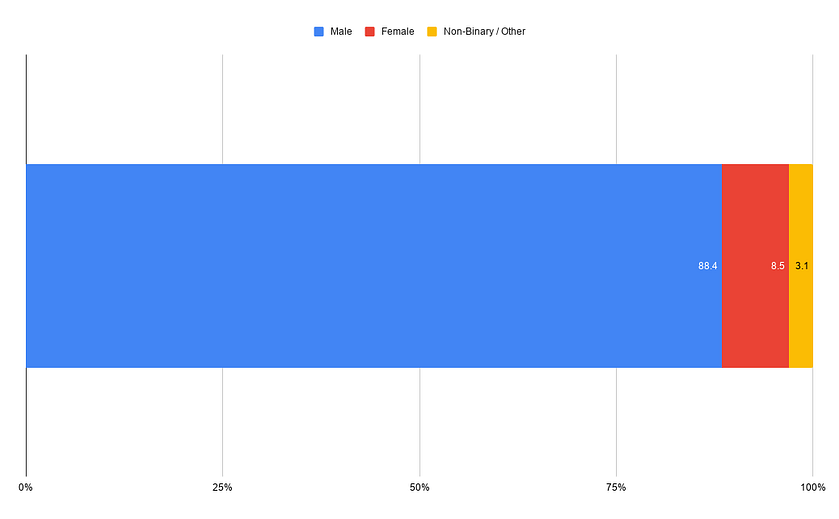
Our wider Colorist community across the nation, are among the least diverse in post. While some of our top Hollywood talents are women and people of color, the greatest majority of us working on calibrated reference displays identify as white and male.

Breaking down the data set
Dailies, assistants, juniors and online editors
All this data really needs to be disaggregated to be meaningful. We get a much more interesting picture when we break down the individual roles, reflecting the reality of our industry. Our 10 DIT respondents in 2019 are spread across the country, and all but one identify as white men. Just over half spend most of their time on commercials. Our Dailies Colorists are all located in Los Angeles and New York, as expected. Two-thirds are working in LA, the same proportion are predominantly on Scripted Television projects, the rest on Features. This reflects “known wisdom”, that the bigger-budget productions more often allow for a workflow that includes a post-house-based specialty dailies colorist, while commercials place more responsibility on the DIT.
Half of dailies colorists report 6-10 years of experience. The most recently hired dailies colorists in this dataset are women, and these women are starting at the median rate for their role.
Assistant and junior colorists are 73% male and 82% white, a fraction more diverse than their senior counterparts. 83% are working in the two major cities. Those outside NY and LA are at commercials houses. The remainder are working predominantly on Features, Television, Commercials and Trailers.
The Online Editors surveyed in 2019 are much more widely spread across the nation, and across the type of content they’re working on. 26% work in New York, 42% in Los Angeles. One-third of professionals working as online editors, finishing artists and/or flame artists are based outside of the two main industry hubs. 84% identify as white and 90% as male. Reported pay rates show that last year, female online editors made 85c to the dollar, compared to their male colleagues with the same level of experience, working on the same content.
Colorists are geographically diverse
More than one-third of colorists are based outside of the two main industry hubs of New York and Los Angeles. Most commonly, those respondents reported that their clients mostly bring them commercials, followed by documentaries and corporate/branded content. Only 10% of colorists in smaller markets are in staff positions, compared to one-third in LA, and 22% in New York.
Who are we (compared to national averages)?
According to the most recent US census data, nationwide 13.4% of adults identify as African-American, 60% white and 18.3% Hispanic. The US Bureau of Labor Statistics notes that in 2017, “women accounted for 52 percent of all workers employed in management, professional, and related occupations, somewhat more than their share of total employment (47 percent)”.
Results from our 2019 survey show that almost 90% of professional colorists across America identify as male. The mostly-white professional workforce includes a small percentage of mixed-race, Hispanic and Asian colorists, but less than 1% identify as African-American. Across all respondents in the 2019 survey, the post production industry self-identifies as, by comparison, 81% white and 65% male.
Show me the (hourly) money
For the groups with less data, we can only get a broad overview of rates. For the others, we have much richer information, that I will break down in all sorts of ways, to discuss what we’re paid, where, for what work, and how. This data is self-reported and broken down to hourly rates for easy comparison, in the 2019 survey.
- Digital Imaging Technicians: DITs reported an average hourly rate of $59.54. Most reported that they are paid by the day, which is usually 10 or 12 hours. Most are paid overtime, and only a small proportion (those working predominantly on feature films), reported being members of a union.
- Dailies colorists: Their average rate was reported at $34.71. Half of the respondents are in staff positions, working 8-hour shifts with paid overtime. Unusually, the average rate reported by staff dailies colorists is higher than freelancers.
- Junior/assistant colorists: They reported an average hourly rate of $37.29. 77% have staff positions. Most are paid by the hour, with overtime. Even those on a straight salary report having an overtime allowance.
- Assistant colorists: Digging deeper in the Assistant Colorist category, their rates rise logarithmically by experience, with starting rates averaging $26/h. Mid-level (3-5 years) in this dataset average $32.26, and established professionals in this field averaging an hourly rate of $52.50. Nobody in this dataset reported having more than 10 years working as an assistant/junior colorist.

- Online editors, finishing artists and flame artists: This group of specialists reported in 2019 an average rate of $75.94. Half are in staff positions and 58% are offered overtime. The distribution of overtime benefits is about equal between staff and freelance professionals in this discipline. The average rate calculated as hourly for online editors in Los Angeles is $78.33, compared to their peers in New York at $75.88. Those working in commercials and short-form content earn significantly more than their long-form peers, at an average rate of $96.43. The long-form subset includes a lot of online editors producing unscripted television, which is often run notoriously lean (especially compared to the world of commercials). Their average rate is $67.
The color (and location) of (big) money

Because we have more rich data on colorists, this section will break down full-time colorist’s rates in all sorts of interesting ways:
- The average hourly rate for colorists in the US has not changed significantly over the past four years, hovering steadily around $115. Los Angeles colorists in 2019 are making an average of $112.75 and New York colorists average $104.97.
- According to the 2019 survey responses, nationwide, colorists who identify as female or non-binary make 77% as much as their male peers with the same level of experience, working on the same content. The data also shows, when comparing those identifying as white to their non-white peers with the same experience, on the same projects, in the same locations – African American, Asian and Hispanic colorists are earning on average 83 cents to the dollar of their white peers.
- By comparison, the nationwide gender pay gap across all industries is just under 5%. This what we call the “controlled” figure – comparing men and women in the same job, with the same experience. Other roles in post production with large datasets from this survey show that Editors have a 10% gender pay gap. And while 54% of Post Producers are women, men in this role make 20% more.
- The controlled nationwide pay gap between white and non-white men in all industries combined is almost non-existent at close to 1%. That said, most studies note that there are still so few non-white men in top-level roles, that it is difficult to make definitive statements claiming that this gap does not exist. For colorists, we have this problem too. And even still, for us, the gap is notably and disappointingly significant.
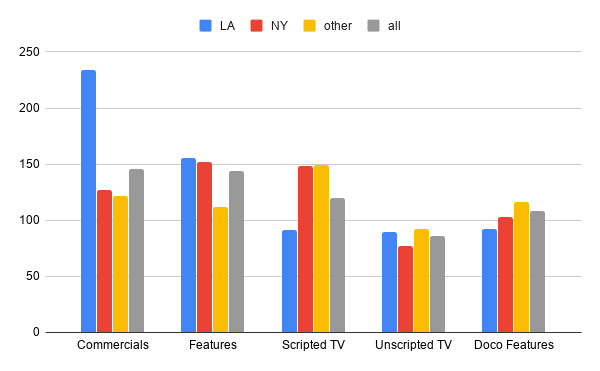
Location matters, and so does the type of content we work on. The following content types are those with enough data across all locations to give us accurate trends. It shows patterns reflecting what sort of content, and the caliber of colorists working on that content, is dominant in each market.
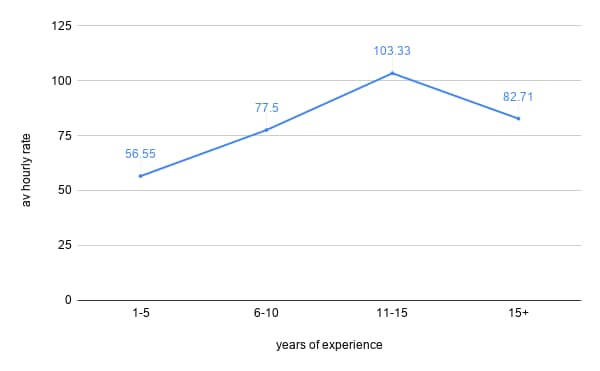
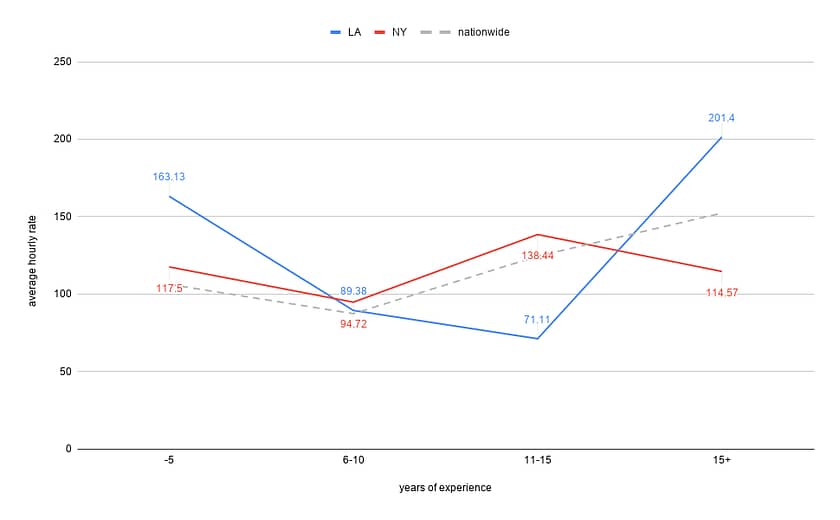
Location and job experience also correlate to average hourly earnings:
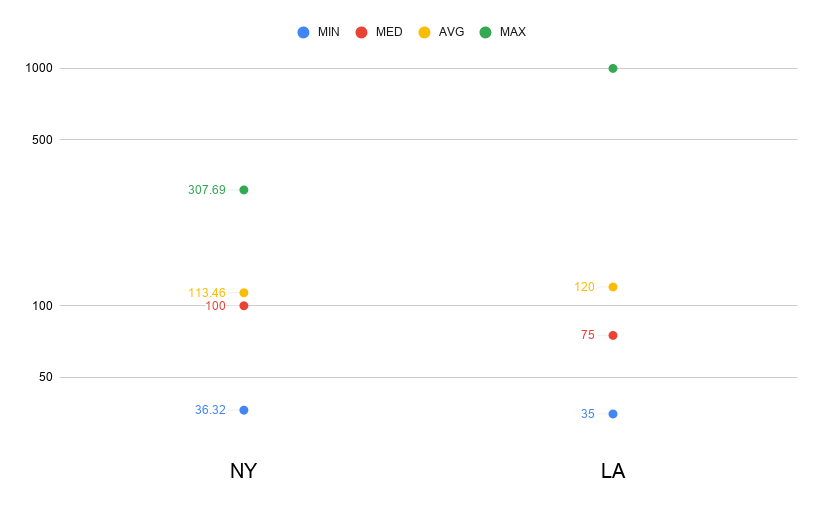
Los Angeles has a lot of colorists, and the rates are spread apart accordingly compared to other markets. The top-earning colorists in America are based there. But so are many more entry-level and lower-paid professionals. Therefore Los Angeles has the highest-paid colorists, but the starting and median rates are lower than those in New York.
Cool Story Bro, So What?
This annual survey is conducted and the full dataset is published publicly every year. There is no specific purpose or use for the information. I started the project in 2016 because a lot of people were asking in forums for any clues about what fair pay rates look like. Our industry has become more fragmented and competitive over the past 15 years. Personal mentorship is all but lost. While the virtues of nostalgia are debatable, there are aspects of growing up in a smaller tight-knit industry which benefited me greatly. Those positive benefits are what I work to preserve, through various personal endeavors.
One positive benefit we can leverage is: Community. In the shared physical spaces of yesteryear’s big post houses, we had more access to mentors and knowledge sharing. Over lunch, we might discuss troubles or techniques. Emerging talent, sitting a table away, could listen, learn, and ask questions. If you were really fortunate (or lucky), you could learn from and ingratiate yourself to the best in the business – as I did. Today’s online communities are essential to maintaining this tradition. Active participation in the likes of Mixing Light, Blue Collar Post Collective, Facebook groups and other industry forums are how we can keep passing around our collective wisdom. We can now offer the benefits of these communities to anyone, anywhere. Regional barriers no longer restrict this opportunity.
Pay transparency has become an oxymoron. When I started my career at a large television network, established “pay bands” existed and were widely disseminated. I knew the lowest and highest possible rate for my job and could see how my experience (and level of privilege) would determine my salary offer. Union jobs established baseline rates for private post houses. In those settings, if you kept your ear to the ground then you could figure out where you were on the pay scale – and what to strive toward.
Pay transparency benefits everyone. But it is a difficult and uncomfortable thing to discuss in public – and especially with peers whom you potentially compete against. That is why I gather this data. That is why I keep it anonymous.
We are leveraging our community to help each other understand the business we are working in today. Some people have used this data to look at what their peers make. They then have the confidence to ask for a rate that is fair and competitive. Others use it to inform programs seeking to make our industry more diverse. I have used it for these two things: In hiring and to simply make myself more aware of what our professional world looks like beyond my own perceptions and preconceived notions.
However you choose to interpret or use this information is up to you. I do hope that it inspires you in some way to make a positive difference in our post production community. Maybe you’ll ask for a raise, seek out more diverse hires, move cities or simply contribute to the Blue Collar Post Collective’s rates survey, taking place every October.
-Katie

